Please find our most recent market review below. We hope these perspectives are valuable to you.
– The AdvicePeriod Team
Key Observations
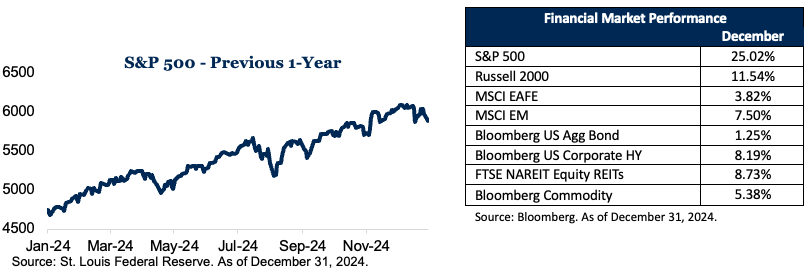
- The S&P 500 index posted impressive gains of over 25% in 2024, marking the second consecutive year of 20%+ returns.
- The U.S. economy demonstrated remarkable resilience, with projected real GDP growth of 2.9% for 2024.
- The Federal Reserve implemented three interest rate cuts throughout 2024, signaling a shift in monetary policy.
- The market rally broadened beyond Big Tech in the latter part of the year, with small-cap stocks seeing significant gains.
- Inflation continued its downward trend, with the Consumer Price Index (CPI) standing at 2.7% year over year in November.
Market Recap

A Year of Impressive Market Gains
2024 proved to be an exceptional year for the U.S. stock market, with the S&P 500 index delivering a stellar performance. The index posted gains of over 25% for the year, marking its second consecutive year of returns exceeding 20%. This remarkable feat hasn’t been witnessed since the late 1990s, underscoring the strength and resilience of the market in the face of various economic challenges.
The Dow Jones Industrial Average also performed admirably, rising by 14.91% year to date. This broad-based rally extended beyond large-cap stocks, with the S&P MidCap 400 and Russell 2000 indices posting gains of 14.27% and 11.54%, respectively. These figures highlight the comprehensive nature of the market’s upward trajectory in 2024.
One of the most notable aspects of this year’s market performance was the frequency of new record highs. The S&P 500 set an impressive 57 all-time highs throughout the year, with new records being established in every month except April and August.1 This consistent upward momentum reflects the strong underlying fundamentals and positive investor sentiment that characterized much of 2024.
The technology sector continued to be a significant driver of market gains, with companies like NVIDIA and Tesla reaching new heights. NVIDIA’s revenue skyrocketed to $91.2 billion in the nine months through October, more than doubling from the previous year, largely due to the surge in demand for AI-related technologies. Tesla’s stock price also hit record levels partly fueled by expectations of potential benefits from Elon Musk’s relationship with the newly elected administration.
However, it’s important to note that the market rally wasn’t solely dependent on the performance of Big Tech stocks. As the year progressed, there was a noticeable broadening of market participation, with sectors such as financials, industrials and consumer discretionary also contributing significantly to overall gains.
Economic Resilience and Growth
The U.S. economy demonstrated remarkable resilience throughout 2024, defying earlier predictions of a potential recession. Real gross domestic product (GDP) growth for the year is projected to reach a robust 2.9%, slightly surpassing the growth rate observed in 2023. This strong economic performance was underpinned by several key factors.
Consumer spending remained a crucial driver of economic growth, showing continued strength despite challenges such as hurricanes impacting large areas of the country. Black Friday and Cyber Monday sales reached record highs, and November retail sales were healthy, indicating robust consumer confidence and spending power. This resilience in household spending was fueled by strong wage growth, increased after-tax income, higher savings and improved consumer sentiment.
The labor market continued to exhibit strength, with the unemployment rate hovering around historically low levels. As of November, the unemployment rate stood at 4.2%, reflecting a tight job market that contributed to wage growth and overall economic stability. This low unemployment rate, combined with solid job creation, played a crucial role in sustaining consumer spending and economic growth.
Business investment also played a significant role in driving economic expansion. Nonresidential investment in machinery, equipment, intellectual property and infrastructure showed strength throughout the year. Government contributions from industrial policies and reshoring efforts further bolstered economic growth, reflecting a concerted effort to strengthen domestic production capabilities.
The housing market, while facing challenges from higher interest rates earlier in the year, showed signs of stabilization and even growth in some areas. The combination of strong wage growth and gradually moderating home prices helped to support activity in this crucial sector of the economy.
Looking ahead to 2025, while some moderation in growth is anticipated, the overall outlook remains positive. Forecasts suggest real GDP growth of about 2.2% for 2025, indicating a continued expansion, albeit at a more sustainable pace.
Federal Reserve’s Shift in Monetary Policy
2024 marked a significant shift in the Federal Reserve’s (Fed’s) monetary policy stance. After years of tightening to combat inflation, the Fed implemented three interest rate cuts throughout the year, signaling a new phase in its approach to managing the economy.
The first rate cut came in September, with the Federal Open Market Committee (FOMC) lowering the federal funds rate by 50 basis points to a range of 4.75% to 5%. This move was seen as a decisive step to support economic growth and stabilize a slowing labor market. The Fed’s decision was influenced by progress on its dual mandate of maximum employment and price stability.
Following the September cut, the Fed implemented two additional 25-basis-point cuts in November and December, bringing the federal funds rate to a range of 4.25% to 4.5% by the end of the year. These cuts reflected the Fed’s assessment that the risks to achieving its employment and inflation goals were moving into better balance.
In its communications, the Fed emphasized that while inflation remained above its 2% target, it had eased substantially over the past year without a significant increase in unemployment. This “soft landing” scenario, where inflation is brought under control without triggering a recession, was a key factor in the Fed’s decision to begin easing monetary policy.
The Fed’s projections, released in December, indicated expectations for further rate cuts in 2025, though fewer than initially anticipated. The median FOMC participant penciled in 100 basis points of cuts for 2025, followed by 50 basis points more in 2026, bringing the projected terminal rate to 2.9%.
Broadening Market Rally
While the early part of 2024 saw the stock market rally largely driven by a handful of mega-cap technology stocks, often referred to as the “Magnificent 7,” the latter part of the year witnessed a significant broadening of market participation.
This shift was evident in the performance of small-cap stocks, which saw substantial gains, particularly in the fourth quarter. The Russell 2000 Index, a benchmark for small-cap stocks, rose nearly 9% in the third quarter and finished higher by over 11.54% year to date. This outperformance of small caps relative to their large-cap counterparts signaled growing investor confidence in the broader economy and a willingness to take on more risk.
The broadening rally was also reflected in sector performance. While technology continued to be a strong performer, other sectors such as financials, industrials and consumer discretionary saw increased investor interest. This rotation was partly driven by expectations of economic policies following the election, with sectors like financials benefiting from prospects of deregulation and increased M&A activity.
The shift toward a more balanced market was welcomed by many investors and analysts, as it suggested a healthier and more sustainable bull market. A broader rally typically indicates that the economic recovery is more widespread and not overly dependent on a small number of large companies.
However, it’s worth noting that despite this broadening, the largest technology companies continued to exert significant influence on overall market performance. The Magnificent 7′ stocks still accounted for a substantial portion of the S&P 500’s gains, albeit less dramatically than in the first half of the year.
Inflation’s Downward Trend
Throughout 2024, inflation continued its downward trajectory, moving closer to the Fed’s 2% target. This cooling of inflationary pressures was a key factor in its decision to begin easing monetary policy and contributed significantly to positive market sentiment.
As of November 2024, the CPI stood at 2.7% year over year, up slightly from 2.6% in October but still significantly lower than the peak levels seen in 2022. This moderate uptick was partly influenced by low base effects from the previous year and did not derail the overall downward trend in inflation.
The Personal Consumption Expenditures (PCE) price index, the Fed’s preferred measure of inflation, showed similar progress. Core PCE inflation, which excludes volatile food and energy prices, stood at 2.8% year over year in January, with a further decline to 2.5% on a six-month annualized basis.
Several factors contributed to the moderation in inflation:
- Supply chain improvements: The resolution of many supply chain disruptions that had driven up prices in previous years helped to ease inflationary pressures.
- Housing market stabilization: While shelter costs remained a significant contributor to inflation, the rate of increase began to moderate as the year progressed.
- Energy prices: Energy costs continued to decline, with gasoline prices falling 8.1% year over year in November.
- Monetary policy effects: The lagged effects of the Fed’s earlier interest rate hikes continued to work through the economy, helping to cool demand-driven inflation.
Looking ahead, many economists and the Federal Reserve projected inflation to continue its gradual decline. Morningstar, for instance, forecast PCE inflation to average 2.4% in 2024 and then fall further to an average of 1.8% starting in 2025 through 2028. This outlook for sustained moderation in inflation played a crucial role in shaping market expectations and Fed policy decisions throughout the year.
In conclusion, 2024 proved to be a year of significant positive developments for the U.S. economy and financial markets. The combination of strong economic growth, a shift toward more accommodative monetary policy, broadening market participation and moderating inflation created a favorable environment for investors. While challenges and uncertainties remain, particularly regarding the sustainability of economic growth and the long-term impacts of policy decisions, the overall trajectory as of the end of 2024 pointed toward continued stability and potential for further gains in the coming year.
Source:
1“How the stock market defied expectations in 2024”
Disclosures:
This market commentary is meant for informational and educational purposes only and does not consider any individual personal considerations. As such, the information contained herein is not intended to be personal investment advice or recommendation. References to specific asset classes and securities are for illustrative purposes only and are not intended to be, and should not be interpreted as, recommendations to purchase or sell any securities or assets classes.
The commentary represents an assessment of the market environment through December 2024. The views and opinions expressed may change based on the market or other conditions. Any opinions, forecasts, and other forward-looking statements expressed herein are not guarantees of any future performance and actual results or developments may differ materially from those projected. The information provided herein is believed to be reliable, but we do not guarantee accuracy, timeliness, or completeness. It is provided “as is” without any express or implied warranties.
Equity securities are subject to price fluctuation and investments made in small and mid-cap companies generally involve a higher degree of risk and volatility than investments in large-cap companies. International securities are generally subject to increased risks, including currency fluctuations and social, economic, and political uncertainties, which could increase volatility. These risks are magnified in emerging markets.
There is no assurance that any investment, plan, or strategy will be successful. Investing involves risk, including the possible loss of principal. Past performance does not guarantee future results, and nothing herein should be interpreted as an indication of future performance. Please consult your financial professional before making any investment or financial decisions.
Indexes are unmanaged and cannot be directly invested in.
Index Definitions: The S&P 500 is a capitalization-weighted index designed to measure the performance of the broad domestic economy through changes in the aggregate market value of 500 stocks representing all major industries. Russell 2000 consists of the 2,000 smallest U.S. companies in the Russell 3000 index. MSCI EAFE is an equity index which captures large and mid-cap representation across Developed Markets countries around the world, excluding the U.S. and Canada. The index covers approximately 85% of the free float-adjusted market capitalization in each country. MSCI Emerging Markets captures large and mid-cap representation across Emerging Markets countries. The index covers approximately 85% of the free-float adjusted market capitalization in each country. Bloomberg U.S. Aggregate Index covers the U.S. investment grade fixed rate bond market, with index components for government and corporate securities, mortgage pass-through securities, and asset-backed securities. Bloomberg U.S. Corporate High Yield Index covers the universe of fixed rate, non-investment grade debt. Eurobonds and debt issues from countries designated as emerging markets (sovereign rating of Baa1/BBB+/BBB+ and below using the middle of Moody’s, S&P, and Fitch) are excluded, but Canadian and global bonds (SEC registered) of issuers in non-EMG countries are included. FTSE NAREIT Equity REITs Index contains all Equity REITs not designed as Timber REITs or Infrastructure REITs. Bloomberg Commodity Index is calculated on an excess return basis and reflects commodity futures price movements. The index rebalances annually weighted 2/3 by trading volume, and 1/3 by world production and weight-caps are applied at the commodity, sector, and group level for diversification. Dow Jones Industrial Average Index is a stock market index of 30 prominent companies listed on stock exchanges in the United States. S&P MidCap 400 Index is composed of mid-cap stocks from the broad U.S. equity market. Includes stocks of 400 medium-sized U.S. companies, representing a spectrum of industries.
AdvicePeriod is another business name and brand utilized by both Mariner, LLC and Mariner Platform Solutions, LLC, each of which is an SEC registered investment adviser. Registration of an investment adviser does not imply a certain level of skill or training. Each firm is in compliance with the current notice filing requirements imposed upon SEC registered investment advisers by those states in which each firm maintains clients. Each firm may only transact business in those states in which it is notice filed or qualifies for an exemption or exclusion from notice filing requirements. Any subsequent, direct communication by an advisor with a prospective client shall be conducted by a representative that is either registered or qualifies for an exemption or exclusion from registration in the state where the prospective client resides. For additional information about Mariner, LLC or Mariner Platform Solutions, LLC, including fees and services, please contact us utilizing the contact information provided herein or refer to the Investment Adviser Public Disclosure website (www.adviserinfo.sec.gov). Please read the disclosure statement carefully before you invest or send money.
For additional information as to which entity your adviser is registered as an investment adviser representative, please refer to the Investment Adviser Public Disclosure website (www.adviserinfo.sec.gov) or the Form ADV 2B provided to you. Investment adviser representatives of Mariner, LLC dba Mariner Wealth Advisors and dba AdvicePeriod are generally employed by Mariner Wealth Advisors, LLC. Investment adviser representatives of Mariner Platform Solutions, LLC dba AdvicePeriod, are independent contractors.
Does past performance matter?
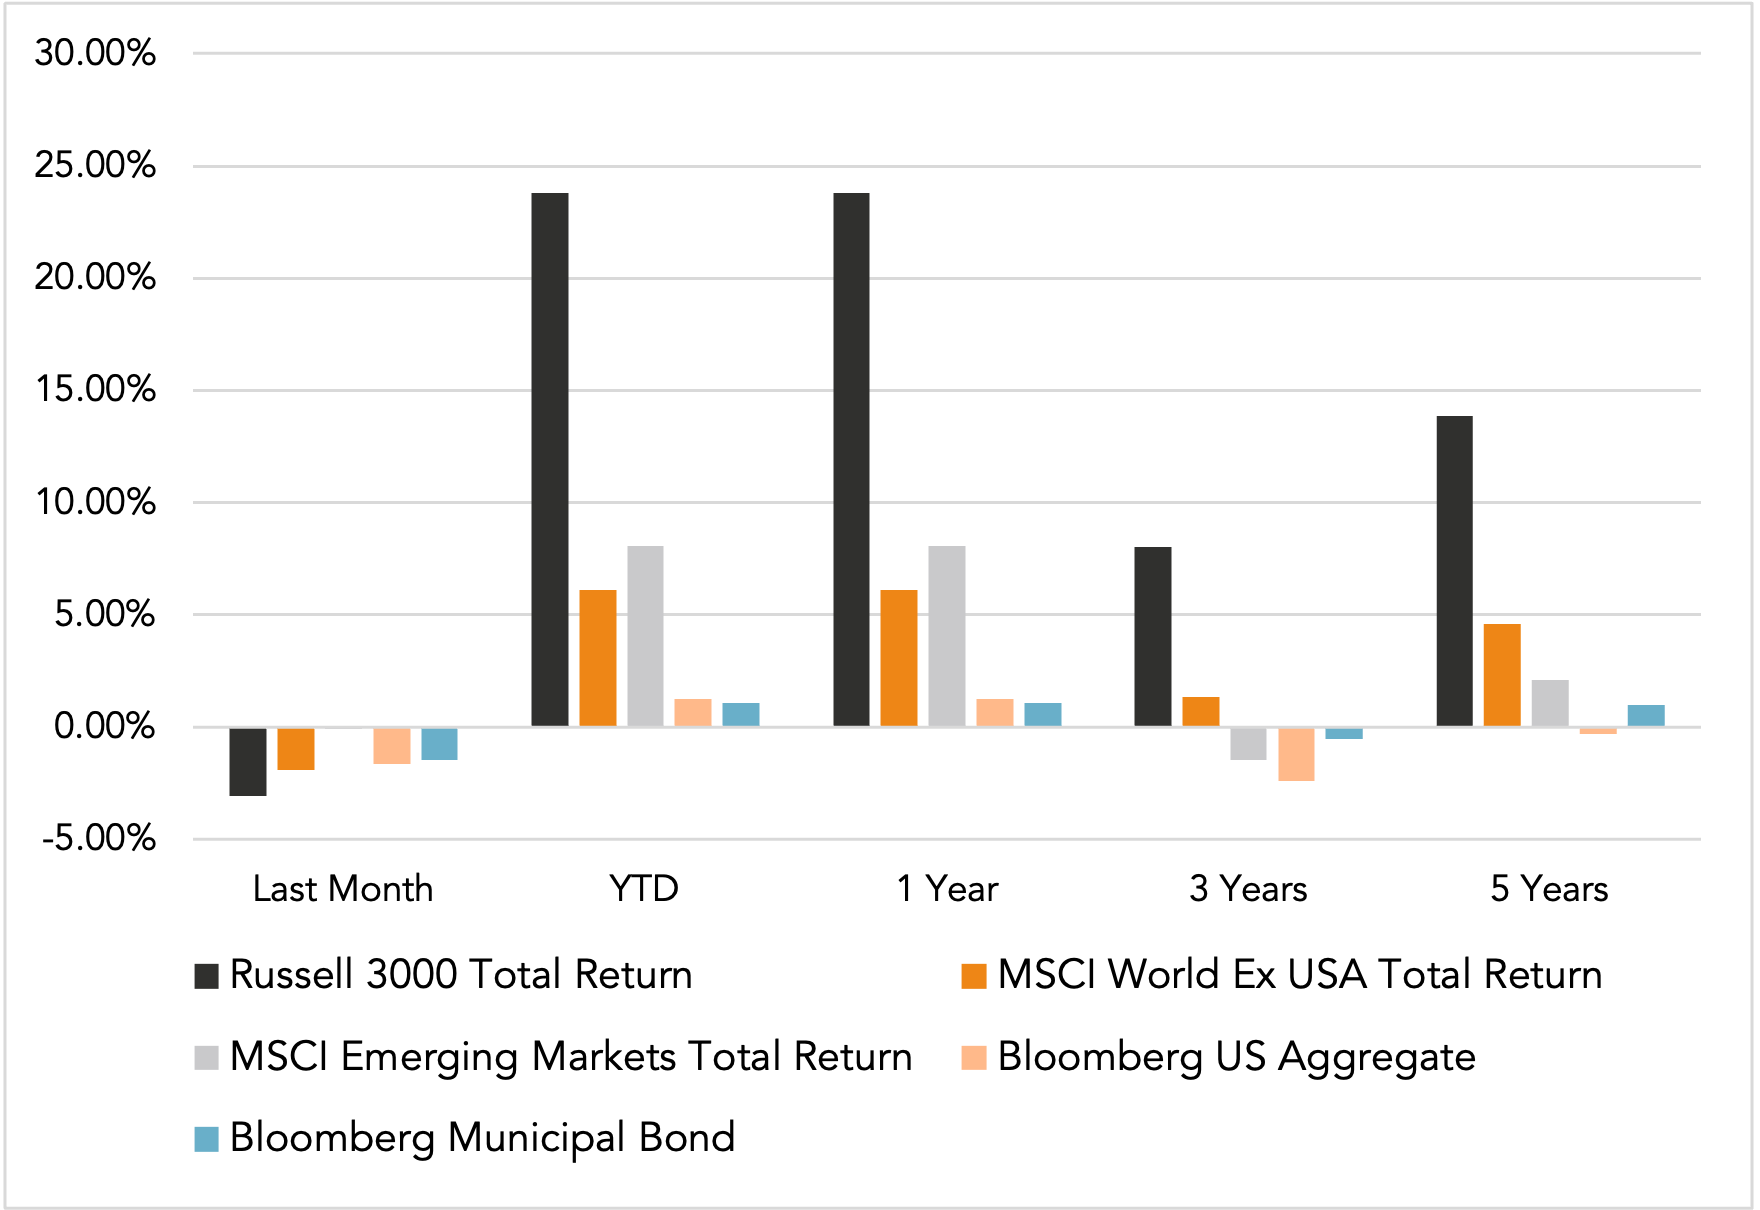
Major Market Index Returns
Period Ending 1/1/2025
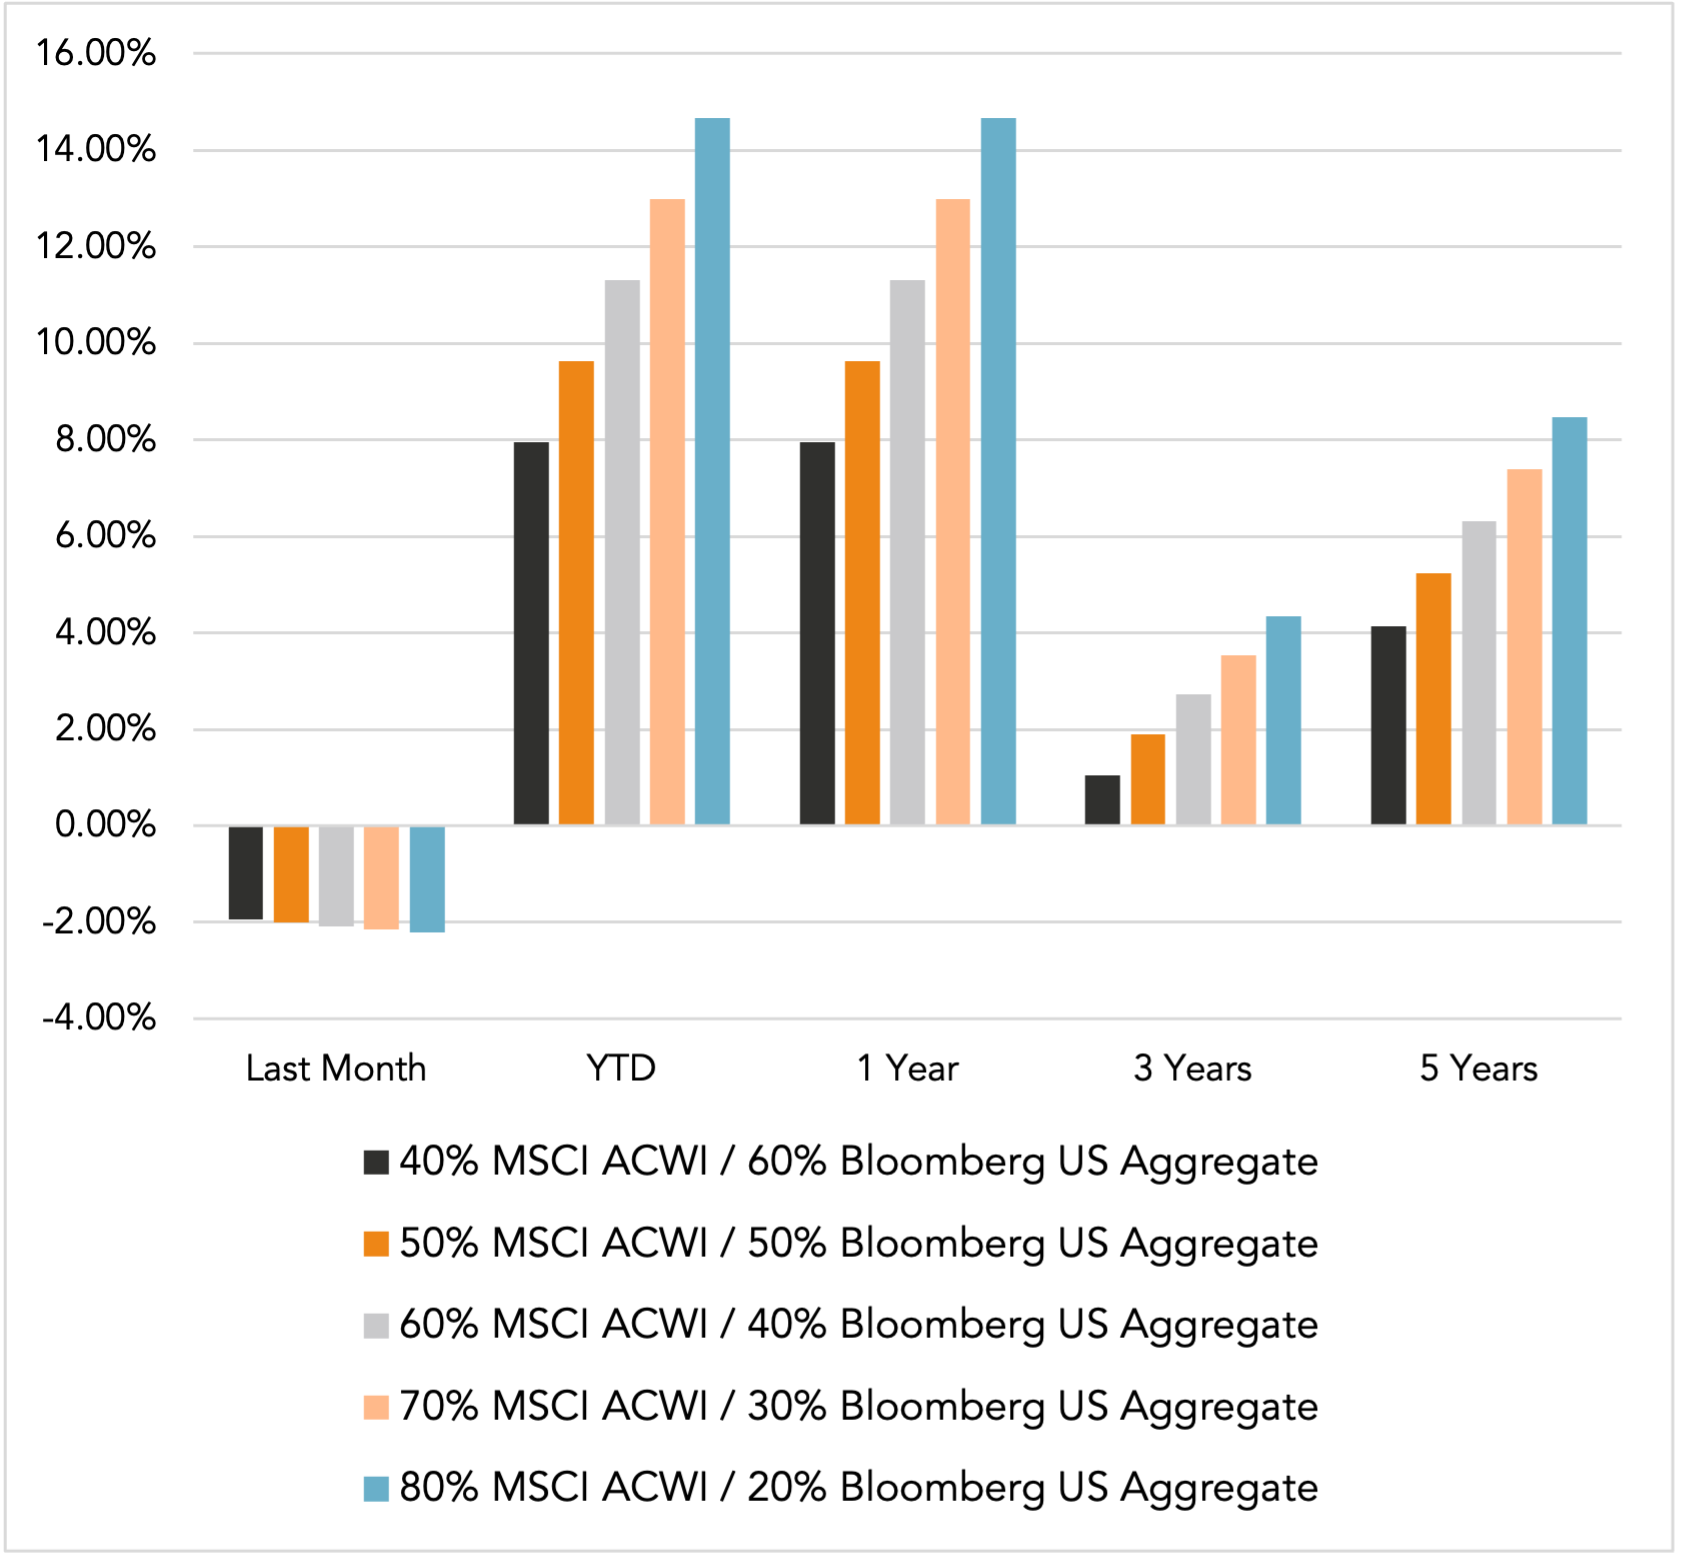
Multi-year returns are annualized.


Mix Index Returns
Global Equity / US Taxable Bonds


Indexes are unmanaged and cannot be directly invested into. Past performance is no indication of future results. Investing involves risk and the potential to lose principal.
The Russell 3000 Index is a United States market index that tracks the 3000 largest companies. MSCI Emerging Markets Index is a broad market cap-weighted Index showing the performance of equities across 23 emerging market countries defined as emerging markets by MSCI. MSCI ACWI ex-U.S. Index is a free-float adjusted market capitalization-weighted index that is designed to measure the equity market performance of developed and emerging markets excluding companies based in the United States. Bloomberg U.S. Aggregate Bond Index represents the investment-grade, U.S. dollar-denominated, fixed-rate taxable bond market, including Treasuries, government-related and corporate securities, as well as mortgage and asset-backed securities. Bloomberg Municipal Index is the US Municipal Index that covers the US dollar-denominated long-term tax-exempt bond market. The index has four main sectors: state and local general obligation bonds, revenue bonds, insured bonds, and prerefunded bonds.


March 2025 Market Commentary