Please find our most recent market review below. We hope these perspectives are valuable to you.
– The AdvicePeriod Team
Another Banner Year (So Far)
Market breadth continues to narrow
Technology stocks lead the market higher in June, again.
Key Observations
- The S&P 500 gained another 3.7% in June, bringing its year-to-date return to 15.5%.
- Small-cap stocks fell 2.2% and are barely breakeven on the year.
- Bonds were up 1.7%, erasing earlier losses, and are also breakeven on the year.
- International developed markets lagged the U.S. and are up just 6% on the year.
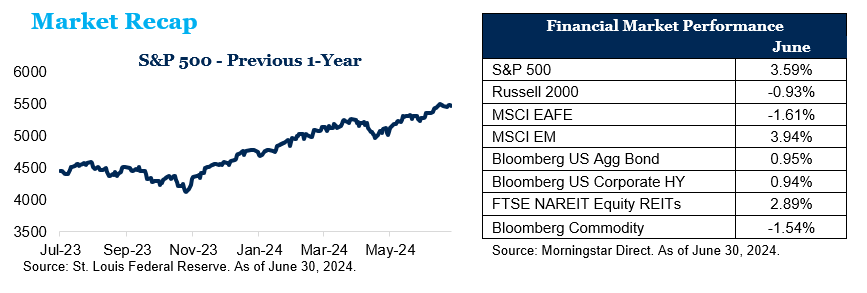
The U.S. stock market performed well again in June, adding 3.6% to bring the total return to just shy of 15.3% for the year. Technology stocks led the way again, gaining 9.3% for the month, and have advanced nearly 42% over the past 12 months. Small-cap stocks were down almost 1% for the month, while mid-caps lost 0.66%. Non-U.S. developed equities fell 1.6%, while emerging market stocks added 3.9%. The Bloomberg U.S. Aggregate Bond Index also had a positive return on the month, rising 1%, while the 10-year Treasury yield fell from 4.50% at the start of the month to 4.39% at month-end. Yields on the 2-year Treasury dropped in June, starting at 4.82% and falling to 4.75%.
The Consumer Price Index rose 3.3% in May, lower than expectations. Core prices increased just 0.2% on the month and 3.4% year-over-year, which was also slightly lower than estimates. Despite the good news, Federal Reserve officials are roughly split between one or two rate cuts from now through the rest of the year. They meet four more times this year, in July, September, November and December. After setbacks at the start of the year, more recent inflation readings have shown improvement.
U.S. job growth far exceeded expectations last month even as the unemployment rate edged up to 4%. Employers added 272,000 new jobs in May, according to the Labor Department, well above the 190,000 that economists had predicted. The unemployment rate rose to 4% for the first time in more than two years. It has been at or below 4% for 30 months, something most working-age Americans have never experienced.
Let the Good Times Roll?
The last 5 years have been among the best of times for stock investors:
Last 5 Years of S&P 500 Total Returns
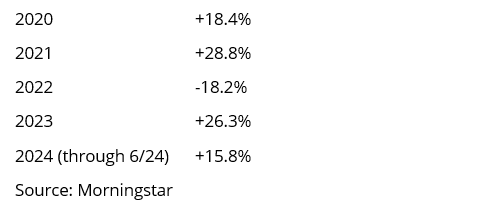
With the notable exception of 2022, it’s been pretty much a one-way street for the bulls. But not all stocks have participated equally.
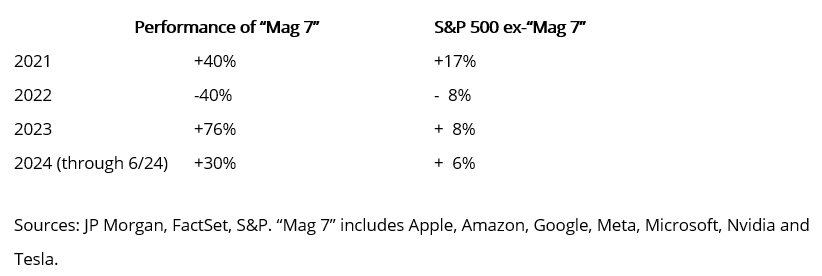
The future seems quite bright for the so-called Magnificent 7. Their recent performance reflects investors’ expectations that they are well-positioned for future growth and for the changes in our economy that will be brought about by advancements in artificial intelligence (AI). Investors who are well-diversified have been frustrated by underperforming categories such as small- and mid-cap stocks, value stocks and international stocks that are not as heavily weighted in the technology winners. It’s worth pointing out, though, that large-cap growth stocks currently trade at 28.1 times forward expected earnings versus a 20-year average price-to-earnings ratio of 19.0, while the other categories of stocks trade either in line with or below their 20-year average. Valuation is a poor timing tool, as stock groups often blow well past “fair value” when investor enthusiasm is nearing a peak. In addition, the past doesn’t always repeat itself. High expectations for these companies may in fact be realized or even exceeded. No one can say for certain how much profit will be generated by the AI revolution.
Diversification is not a perfect tool—it cannot prevent losses. But one thing is certain: Diversification is a tried-and-true investment principle that has time and time again prevented many investors from making really big mistakes. Diversification is also one of the most difficult strategies to adhere to at times like this when a small group of winners creates massive FOMO (fear of missing out) on the part of investors, and everything else in your portfolio seems to be a dud. Warren Buffett once said, “Investing is simple, but it’s not easy.” Buffett’s teacher, Ben Graham, introduced in his 1949 book “The Intelligent Investor” the idea of Mr. Market, an imaginary investor who is driven by panic, euphoria and apathy on any given day and approached investing as a reaction to his mood rather than through solid investment analysis.
Our advice is simple: If you have a well-thought-out investment plan and a portfolio that is well-diversified, stay the course and avoid the temptation of chasing popular investments as their popularity grows. Chances are if your portfolio is well-diversified, you own an appropriate amount of the stocks that are performing so well. You may be lagging some of the benchmarks like the S&P 500, but markets have been, and always will be, cyclical. To put it another way, the sun doesn’t shine on the same dog’s back all the time.
Disclosures:
This market commentary is meant for informational and educational purposes only and does not consider any individual personal considerations. As such, the information contained herein is not intended to be personal investment advice or recommendation. References to specific asset classes and securities are for illustrative purposes only and are not intended to be, and should not be interpreted as, recommendations to purchase or sell any securities or assets classes.
The commentary represents an assessment of the market environment through June 2024. The views and opinions expressed may change based on the market or other conditions. The forward-looking statements are based on certain assumptions, but there can be no assurance that forward-looking statements will materialize. This commentary was written and provided by an unaffiliated third party; we cannot guarantee the accuracy or completeness of any statements or data contained herein.
Indexes are unmanaged and cannot be directly invested into. Past performance is no indication of future results. Investing involves risk and the potential to lose principal.
AdvicePeriod is another business name and brand utilized by both Mariner, LLC and Mariner Platform Solutions, LLC, each of which is an SEC registered investment adviser. Registration of an investment adviser does not imply a certain level of skill or training. Each firm is in compliance with the current notice filing requirements imposed upon SEC registered investment advisers by those states in which each firm maintains clients. Each firm may only transact business in those states in which it is notice filed or qualifies for an exemption or exclusion from notice filing requirements. Any subsequent, direct communication by an advisor with a prospective client shall be conducted by a representative that is either registered or qualifies for an exemption or exclusion from registration in the state where the prospective client resides. For additional information about Mariner, LLC or Mariner Platform Solutions, LLC, including fees and services, please contact us utilizing the contact information provided herein or refer to the Investment Adviser Public Disclosure website (www.adviserinfo.sec.gov). Please read the disclosure statement carefully before you invest or send money.
For additional information as to which entity your adviser is registered as an investment adviser representative, please refer to the Investment Adviser Public Disclosure website (www.adviserinfo.sec.gov) or the Form ADV 2B provided to you. Investment adviser representatives of Mariner, LLC dba Mariner Wealth Advisors and dba AdvicePeriod are generally employed by Mariner Wealth Advisors, LLC. Investment adviser representatives of Mariner Platform Solutions, LLC dba AdvicePeriod, are independent contractors.
Index Definitions: The S&P 500 is a capitalization-weighted index designed to measure the performance of the broad domestic economy through changes in the aggregate market value of 500 stocks representing all major industries. Russell 2000 consists of the 2,000 smallest U.S. companies in the Russell 3000 index. MSCI EAFE is an equity index which captures large and mid-cap representation across Developed Markets countries around the world, excluding the U.S. and Canada. The index covers approximately 85% of the free float-adjusted market capitalization in each country. MSCI Emerging Markets captures large and mid-cap representation across Emerging Markets countries. The index covers approximately 85% of the free-float adjusted market capitalization in each country. Bloomberg U.S. Aggregate Index covers the U.S. investment grade fixed rate bond market, with index components for government and corporate securities, mortgage pass-through securities, and asset-backed securities. Bloomberg U.S. Corporate High Yield Index covers the universe of fixed rate, non-investment grade debt. Eurobonds and debt issues from countries designated as emerging markets (sovereign rating of Baa1/BBB+/BBB+ and below using the middle of Moody’s, S&P, and Fitch) are excluded, but Canadian and global bonds (SEC registered) of issuers in non-EMG countries are included. FTSE NAREIT Equity REITs Index contains all Equity REITs not designed as Timber REITs or Infrastructure REITs. Bloomberg Commodity Index is calculated on an excess return basis and reflects commodity futures price movements. The index rebalances annually weighted 2/3 by trading volume, and 1/3 by world production and weight-caps are applied at the commodity, sector, and group level for diversification.
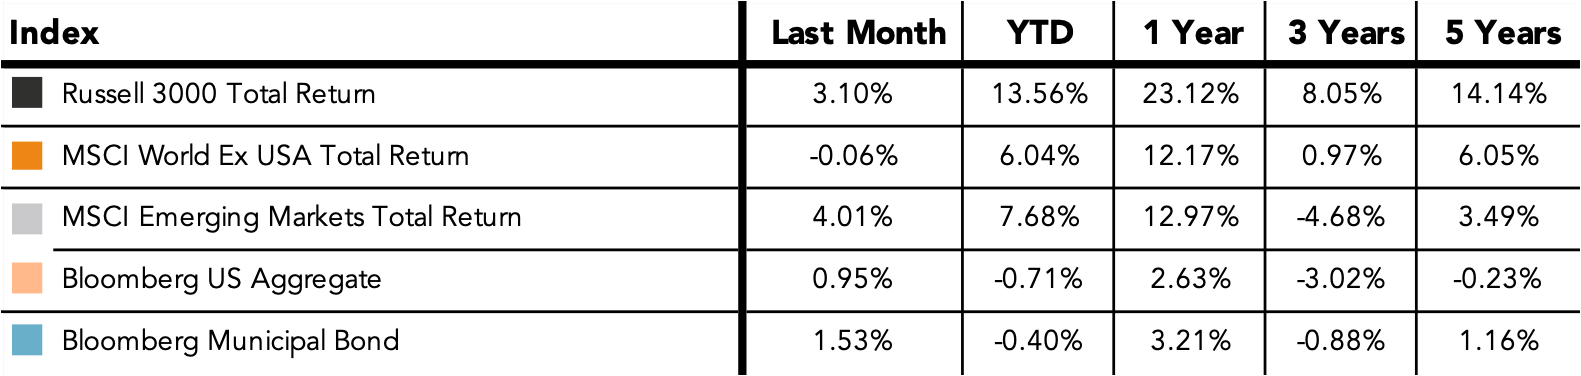
Does past performance matter?
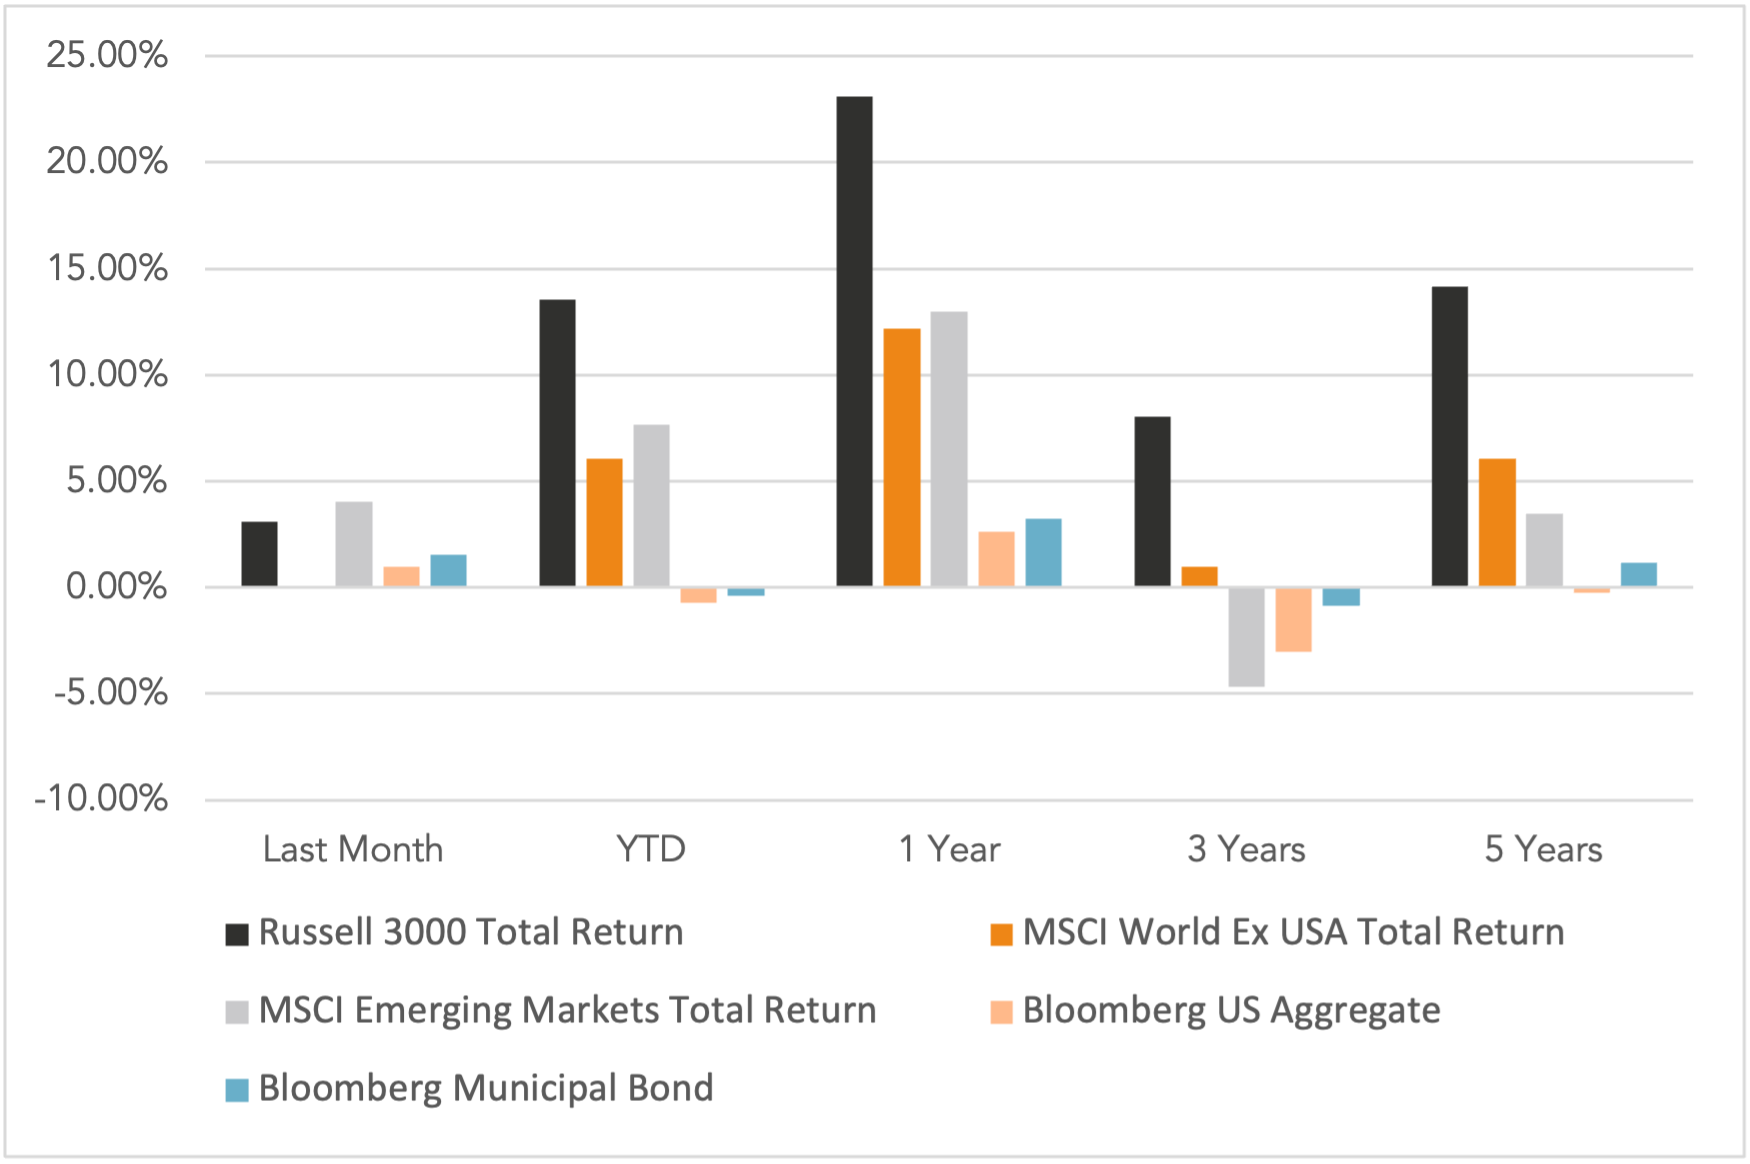
Major Market Index Returns
Period Ending 7/1/2024
Multi-year returns are annualized.
Mix Index Returns
Global Equity / US Taxable Bonds
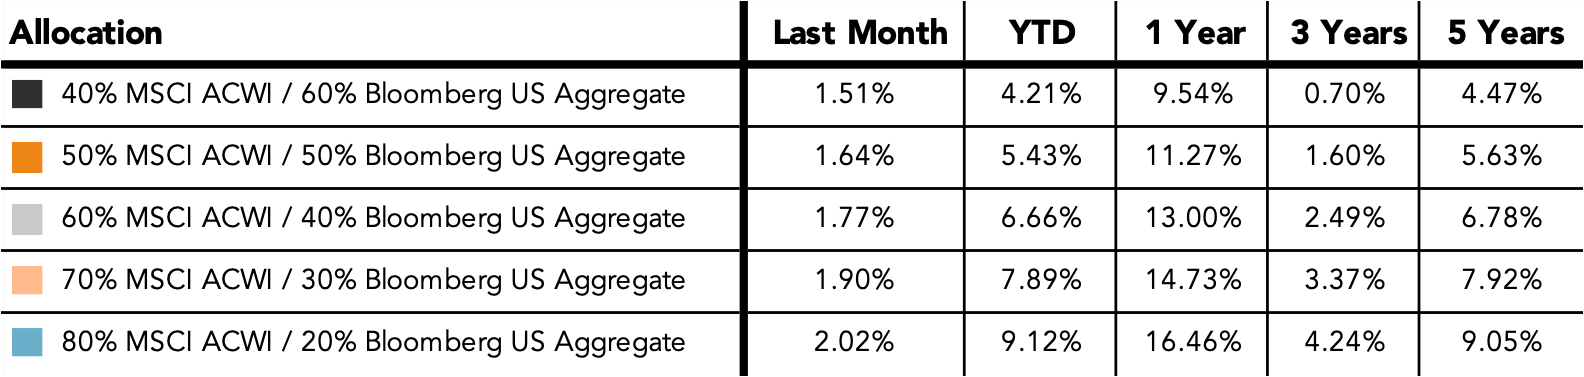
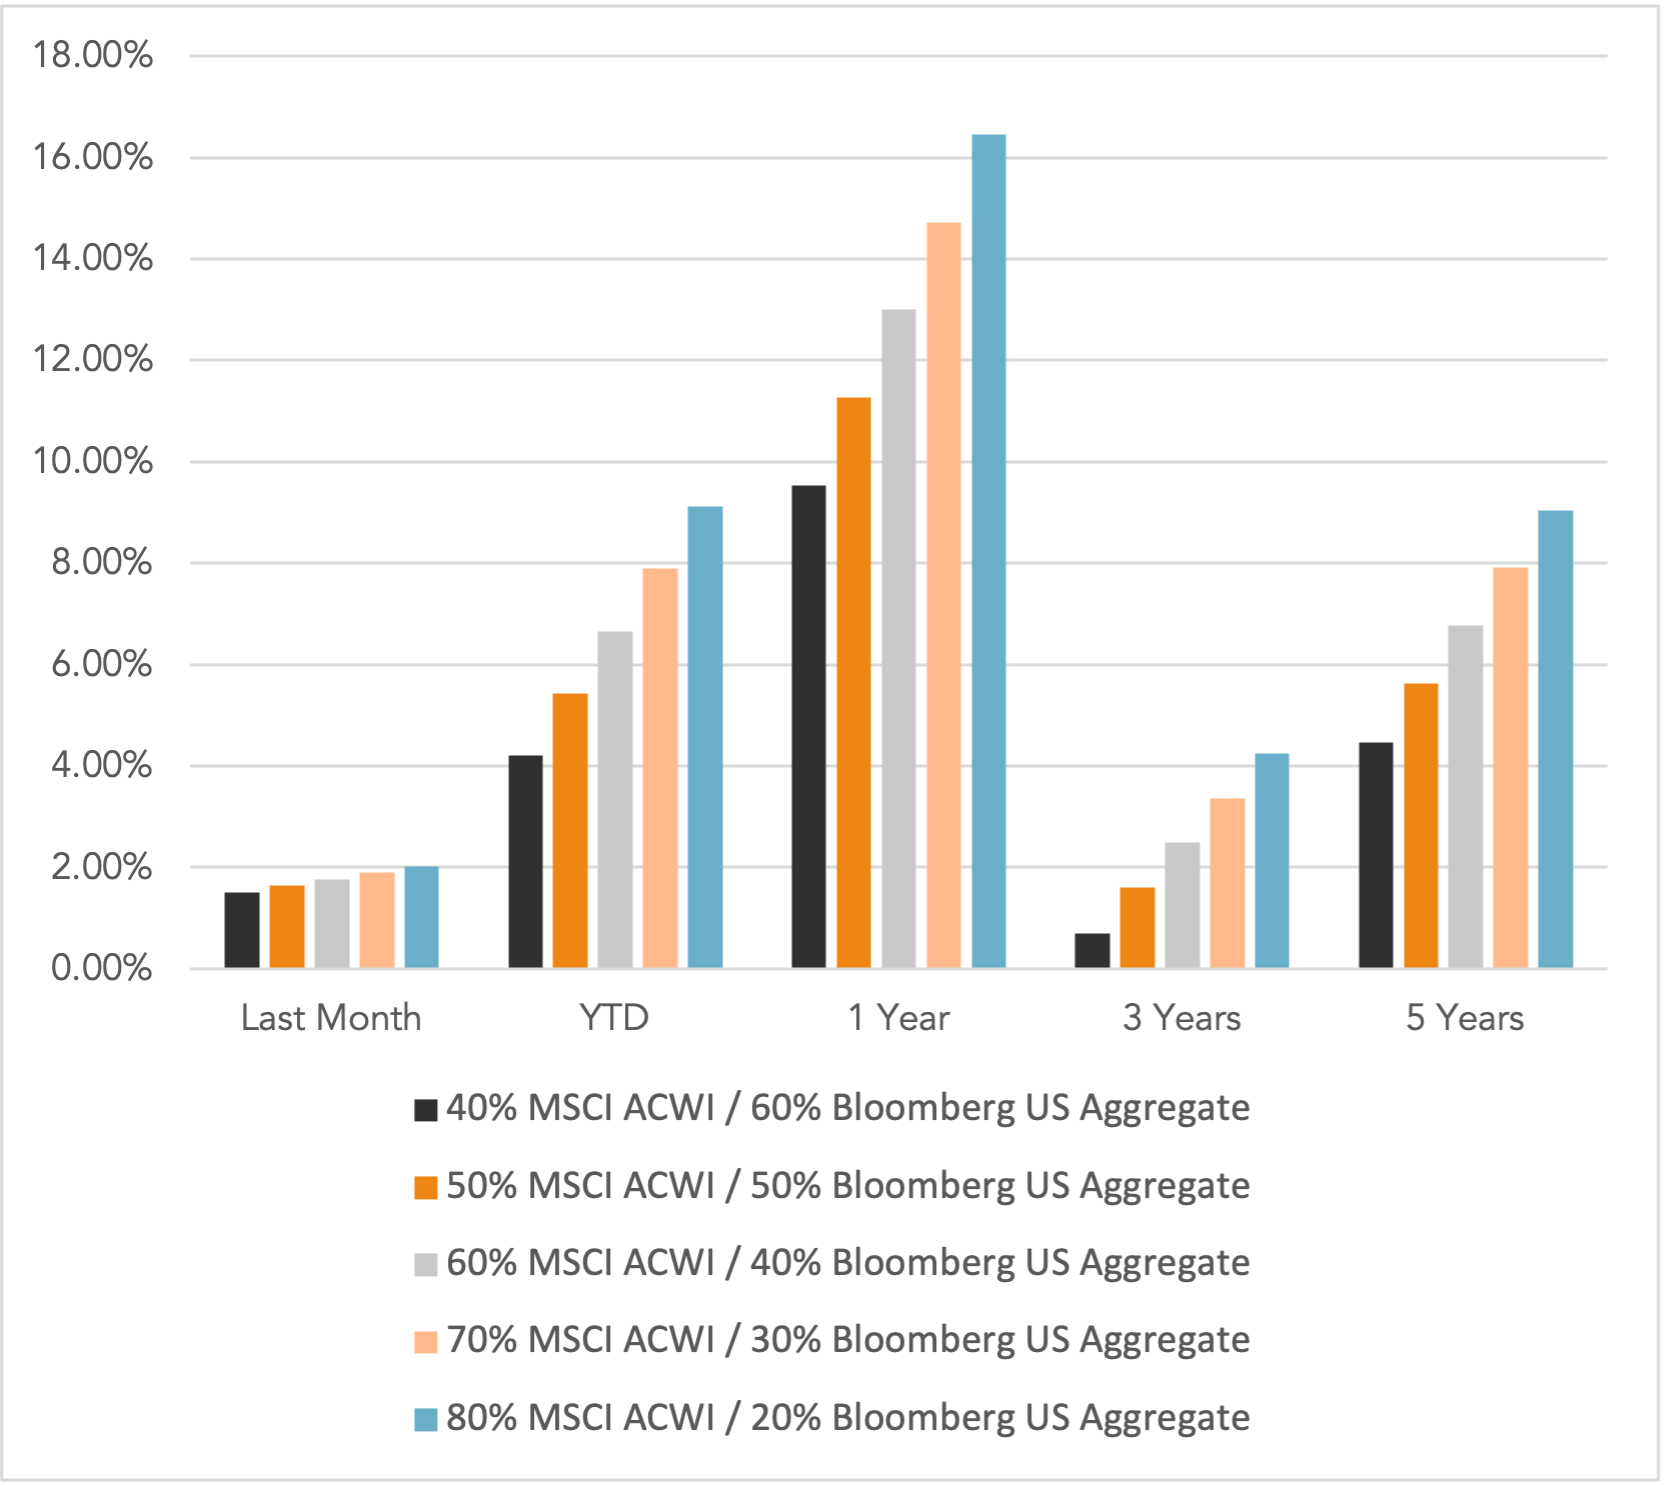
Indexes are unmanaged and cannot be directly invested into. Past performance is no indication of future results. Investing involves risk and the potential to lose principal.
The Russell 3000 Index is a United States market index that tracks the 3000 largest companies. MSCI Emerging Markets Index is a broad market cap-weighted Index showing the performance of equities across 23 emerging market countries defined as emerging markets by MSCI. MSCI ACWI ex-U.S. Index is a free-float adjusted market capitalization-weighted index that is designed to measure the equity market performance of developed and emerging markets excluding companies based in the United States. Bloomberg U.S. Aggregate Bond Index represents the investment-grade, U.S. dollar-denominated, fixed-rate taxable bond market, including Treasuries, government-related and corporate securities, as well as mortgage and asset-backed securities. Bloomberg Municipal Index is the US Municipal Index that covers the US dollar-denominated long-term tax-exempt bond market. The index has four main sectors: state and local general obligation bonds, revenue bonds, insured bonds, and prerefunded bonds.


February 2025 Market Commentary