Please find our most recent market review below. We hope these perspectives are valuable to you.
– The AdvicePeriod Team
Real Estate Getting a Boost From Lower Rates
Broad market indices include REITs, which may be a good thing
Real estate saw gains for the first time in three years—and more could follow
Key Observations
- The S&P 500 gained 2.43% in August, bringing its year-to-date return to 19.53%.
- Small-cap stocks lost 1.49% in August but have advanced 10.39% so far this year.
- Bonds were up 1.44%, boosting previous gains, and have added 3.07% YTD.
- International developed markets rose 3.25% in August and are ahead 11.96% on the year.
Market Recap
The U.S. stock market performed well again in August, adding 2.43% to bring the total return to 19.53% for the year so far. Technology stocks improved from last month by gaining 0.75%, lifting the total year-to-date return to 14.91% for the sector. After a stellar month in July, small-cap stocks lost some ground by declining 1.49% in August. Non-U.S. developed equities rose 3.25%, outpacing U.S. markets, while emerging market stocks added 1.61%. The Bloomberg U.S. Aggregate Bond Index also had a positive return on the month, advancing 1.44%. The 10-year Treasury yield fell from 4.09% at the start of the month to 3.91% at month-end while yields on the 2-year Treasury dropped as well, starting at 4.29% and falling to 3.91%. This marks an interesting time for bonds, as the 2- and 10-year rates are currently no longer inverted. The 2- and 10-year yields have been inverted since July 2022, making it the longest inversion ever recorded.
Overall inflation dropped once again to 2.9% in July from 3.0% in June. More importantly, core inflation decreased again as well to 3.2% in July from June’s 3.3%. The Federal Reserve’s dot plot (which is a chart of each Fed official’s short-term interest rate projections) currently sees the federal funds rate dropping from 5.25%-5.50% to 3.00%-3.25% by 2026. Current economic projections put core inflation at 2.8% by year-end and signal one rate cut this year followed by four in 2025 and four more in 2026, dropping current rates by a total of 225 basis points. At this point, a rate cut of at least 25 basis points is highly anticipated in September.
U.S. job growth was lower than expected in July, coming in at 114,000 new jobs added. The unemployment rate rose to 4.3% in July compared to 4.1% in June, which marks the highest unemployment rate since October 2021. The decline in job growth shows that the labor market is normalizing. This should give the Fed even more reason to begin cutting rates soon.
An Inflection Point for Equity REITs?
As the Fed begins the next rate-cutting cycle, which is likely to last for several years, the economy enters a new regime of lower short-term borrowing rates that has the potential to boost REIT values in several ways:
- A lower-rate environment is a key driver for REIT returns. Lower rates mean lower borrowing costs and better acquisition prices for REIT companies. This can help stabilize asset volatility, as overall costs are lower. Decreasing rates also make the REIT dividends more attractive. Additionally, lower rates mean bonds will be issued at lower coupons, while REIT dividends are typically more stable. This may lead to higher demand for REITs to support income needs.
- REITs are currently sitting at historically attractive valuations. In the past, REITs on average have traded at multiples higher than broad market equities (price-to-earnings (P/E) multiple of .5x higher). Currently, relative to broad market equities, REITs are trading at a P/E multiple of -5.8x. This is a rare occurrence.
- Publicly traded REITs are well positioned to become net acquirers of properties. For example, the world’s largest operator of cold storage warehouses raised $5.1 billion in 2024, which was the largest REIT IPO ever. Other large real estate companies Blackstone and Welltower have been hunting for acquisitions this year, purchasing roughly $6 billion in housing alone between the two firms. REIT companies are poised to take advantage of the lower cost of debt going forward. (Source: Cohen & Steers, August 2024)
REITs Help Diversify Within Broad Market Equities
Besides potentially favorable valuations and an improving economic environment for the asset class, REITs can improve the diversification of risk, return and yield within the broad market. The chart below shows the 10-year correlation matrix between equity REITs and other major asset class indices. With less-than-perfect correlations to most major investments, REITs can increase risk-adjusted returns to a portfolio.

Having diverse sources of yield can also be important as interest rates move lower. The chart below shows the average yield of broad market stocks, bonds and equity REITs so far this year. After clients have had to put up with low bond yields for years, the Fed rate-hiking cycle has made fixed income interesting again, with yields jumping several percentage points across the yield curve. Now that we are likely at the end of the rate-hiking cycle and the beginning of the rate-cutting cycle, bond yields should start to decrease over the next few years. Having diverse sources of income-producing investments helps stabilize clients’ income needs over the long term.

As always, we believe that a diversified approach to asset allocation is of the utmost importance. As market environments change, it is important to know where the risks are and how your portfolio should perform given a range of outcomes. Fortunately, REITs are already included in broad market indices, so well-diversified portfolios already have exposure to them.
Disclosures:
This market commentary is meant for informational and educational purposes only and does not consider any individual personal considerations. As such, the information contained herein is not intended to be personal investment advice or recommendation. References to specific asset classes and securities are for illustrative purposes only and are not intended to be, and should not be interpreted as, recommendations to purchase or sell any securities or assets classes.
The commentary represents an assessment of the market environment through August 2024. The views and opinions expressed may change based on the market or other conditions. Forward-looking statements are subject to numerous assumptions, risks, and uncertainties, which change over time. Actual results could differ materially. This commentary was written and provided by an unaffiliated third party; we cannot guarantee the accuracy or completeness of any statements or data contained herein.
Investing involves risk, including the possible loss of principal. Past performance does not guarantee future results, and nothing herein should be interpreted as an indication of future performance.
Risks of the investing in REITs are similar to those associated with direct ownership of real estate, such as changes in real estate values and property taxes, interest rates, cash flow of underlying real estate assets, supply and demand, and the management skill and creditworthiness of the issuer.
Diversification and asset allocation strategies do not ensure a profit and cannot protect against losses in a declining market.
Yields referenced herein are not guaranteed and are subject to change at any time.
AdvicePeriod is another business name and brand utilized by both Mariner, LLC and Mariner Platform Solutions, LLC, each of which is an SEC registered investment adviser. Registration of an investment adviser does not imply a certain level of skill or training. Each firm is in compliance with the current notice filing requirements imposed upon SEC registered investment advisers by those states in which each firm maintains clients. Each firm may only transact business in those states in which it is notice filed or qualifies for an exemption or exclusion from notice filing requirements. Any subsequent, direct communication by an advisor with a prospective client shall be conducted by a representative that is either registered or qualifies for an exemption or exclusion from registration in the state where the prospective client resides. For additional information about Mariner, LLC or Mariner Platform Solutions, LLC, including fees and services, please contact us utilizing the contact information provided herein or refer to the Investment Adviser Public Disclosure website (www.adviserinfo.sec.gov). Please read the disclosure statement carefully before you invest or send money.
For additional information as to which entity your adviser is registered as an investment adviser representative, please refer to the Investment Adviser Public Disclosure website (www.adviserinfo.sec.gov) or the Form ADV 2B provided to you. Investment adviser representatives of Mariner, LLC dba Mariner Wealth Advisors and dba AdvicePeriod are generally employed by Mariner Wealth Advisors, LLC. Investment adviser representatives of Mariner Platform Solutions, LLC dba AdvicePeriod, are independent contractors.
Index Definitions: The S&P 500 is a capitalization-weighted index designed to measure the performance of the broad domestic economy through changes in the aggregate market value of 500 stocks representing all major industries. Russell 2000 consists of the 2,000 smallest U.S. companies in the Russell 3000 index. MSCI EAFE is an equity index which captures large and mid-cap representation across Developed Markets countries around the world, excluding the U.S. and Canada. The index covers approximately 85% of the free float-adjusted market capitalization in each country. MSCI Emerging Markets captures large and mid-cap representation across Emerging Markets countries. The index covers approximately 85% of the free-float adjusted market capitalization in each country. Bloomberg U.S. Aggregate Index covers the U.S. investment grade fixed rate bond market, with index components for government and corporate securities, mortgage pass-through securities, and asset-backed securities. Bloomberg U.S. Corporate High Yield Index covers the universe of fixed rate, non-investment grade debt. Eurobonds and debt issues from countries designated as emerging markets (sovereign rating of Baa1/BBB+/BBB+ and below using the middle of Moody’s, S&P, and Fitch) are excluded, but Canadian and global bonds (SEC registered) of issuers in non-EMG countries are included. FTSE NAREIT Equity REITs Index contains all Equity REITs not designed as Timber REITs or Infrastructure REITs. Bloomberg Commodity Index is calculated on an excess return basis and reflects commodity futures price movements. The index rebalances annually weighted 2/3 by trading volume, and 1/3 by world production and weight-caps are applied at the commodity, sector, and group level for diversification. Russell 2000 Value Index tracks the performance of Russell 2000 companies with lower price-to-book ratios and lower forecasted growth values. Russell Top 50 Index also known as the Russell Top 50 Mega Cap is a stock market index that measures the performance of the largest companies in the Russell 3000 Index.
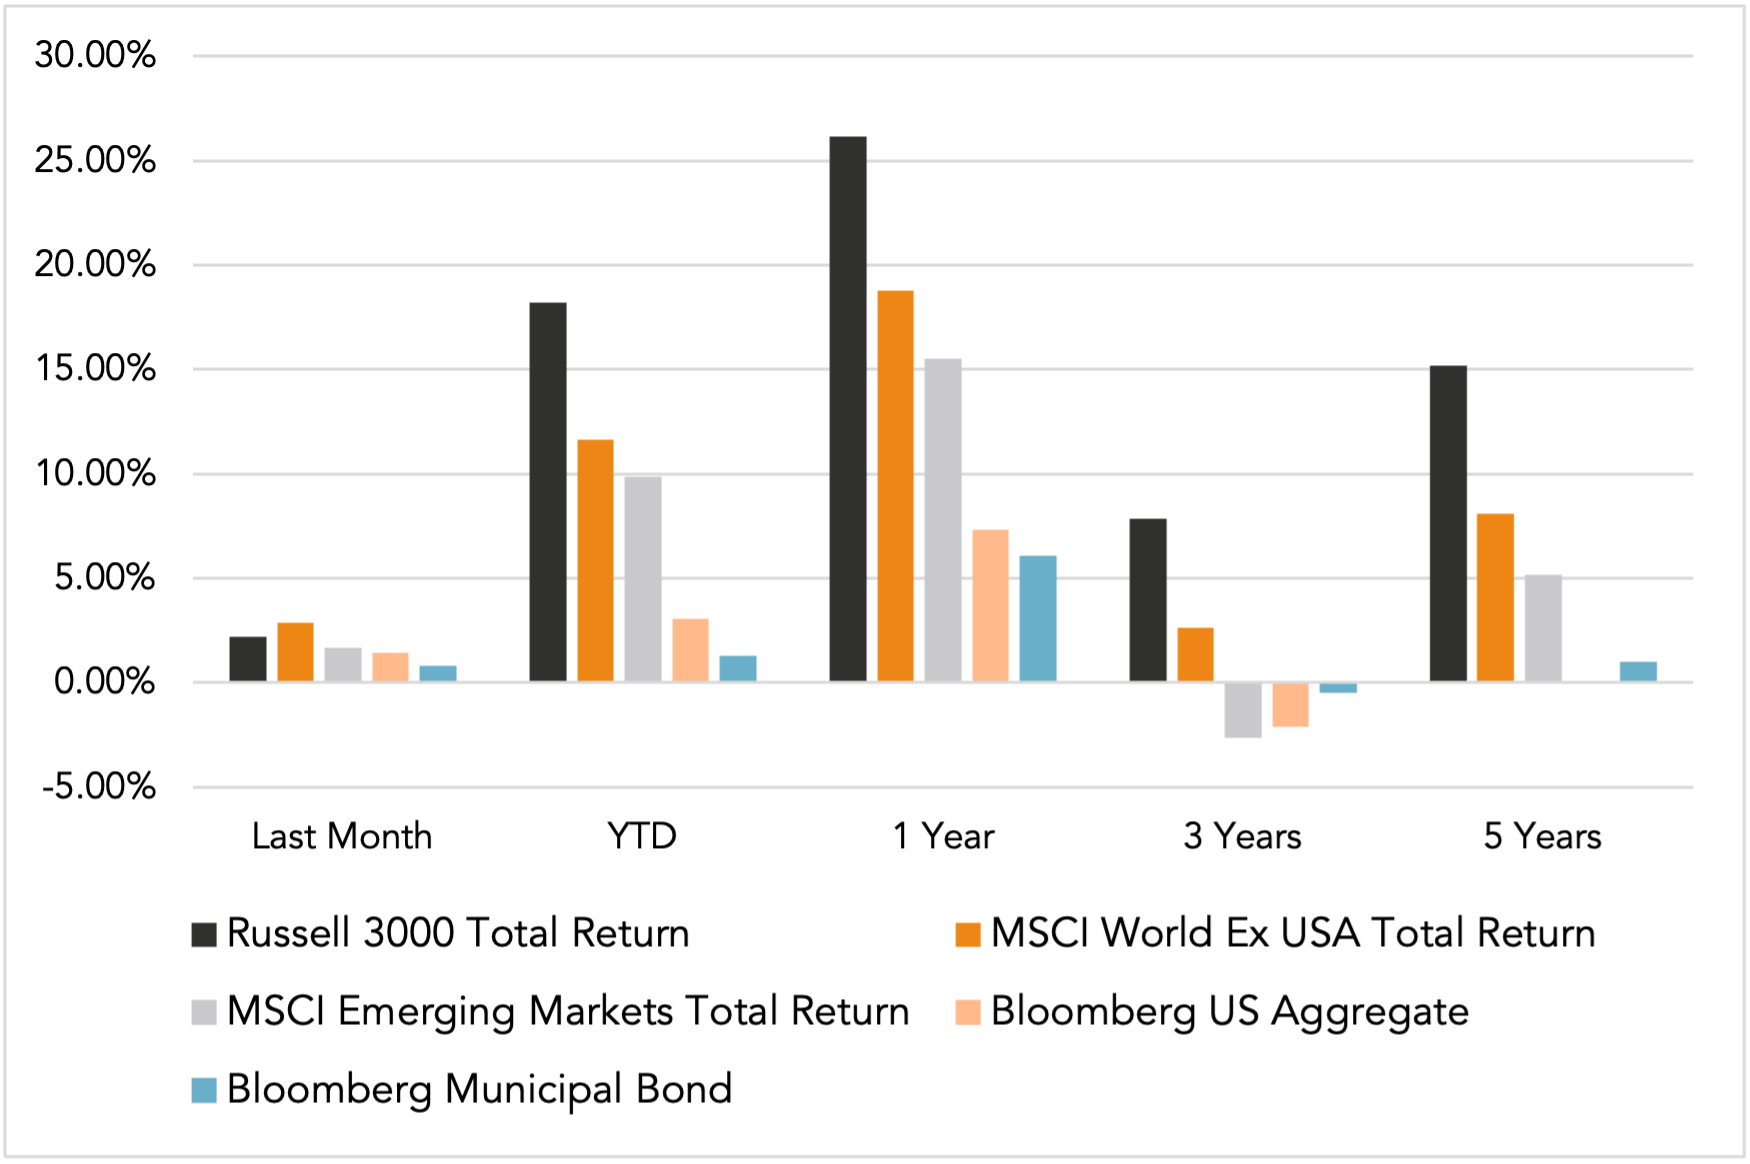
Does past performance matter?
Major Market Index Returns
Period Ending 9/1/2024
Multi-year returns are annualized.


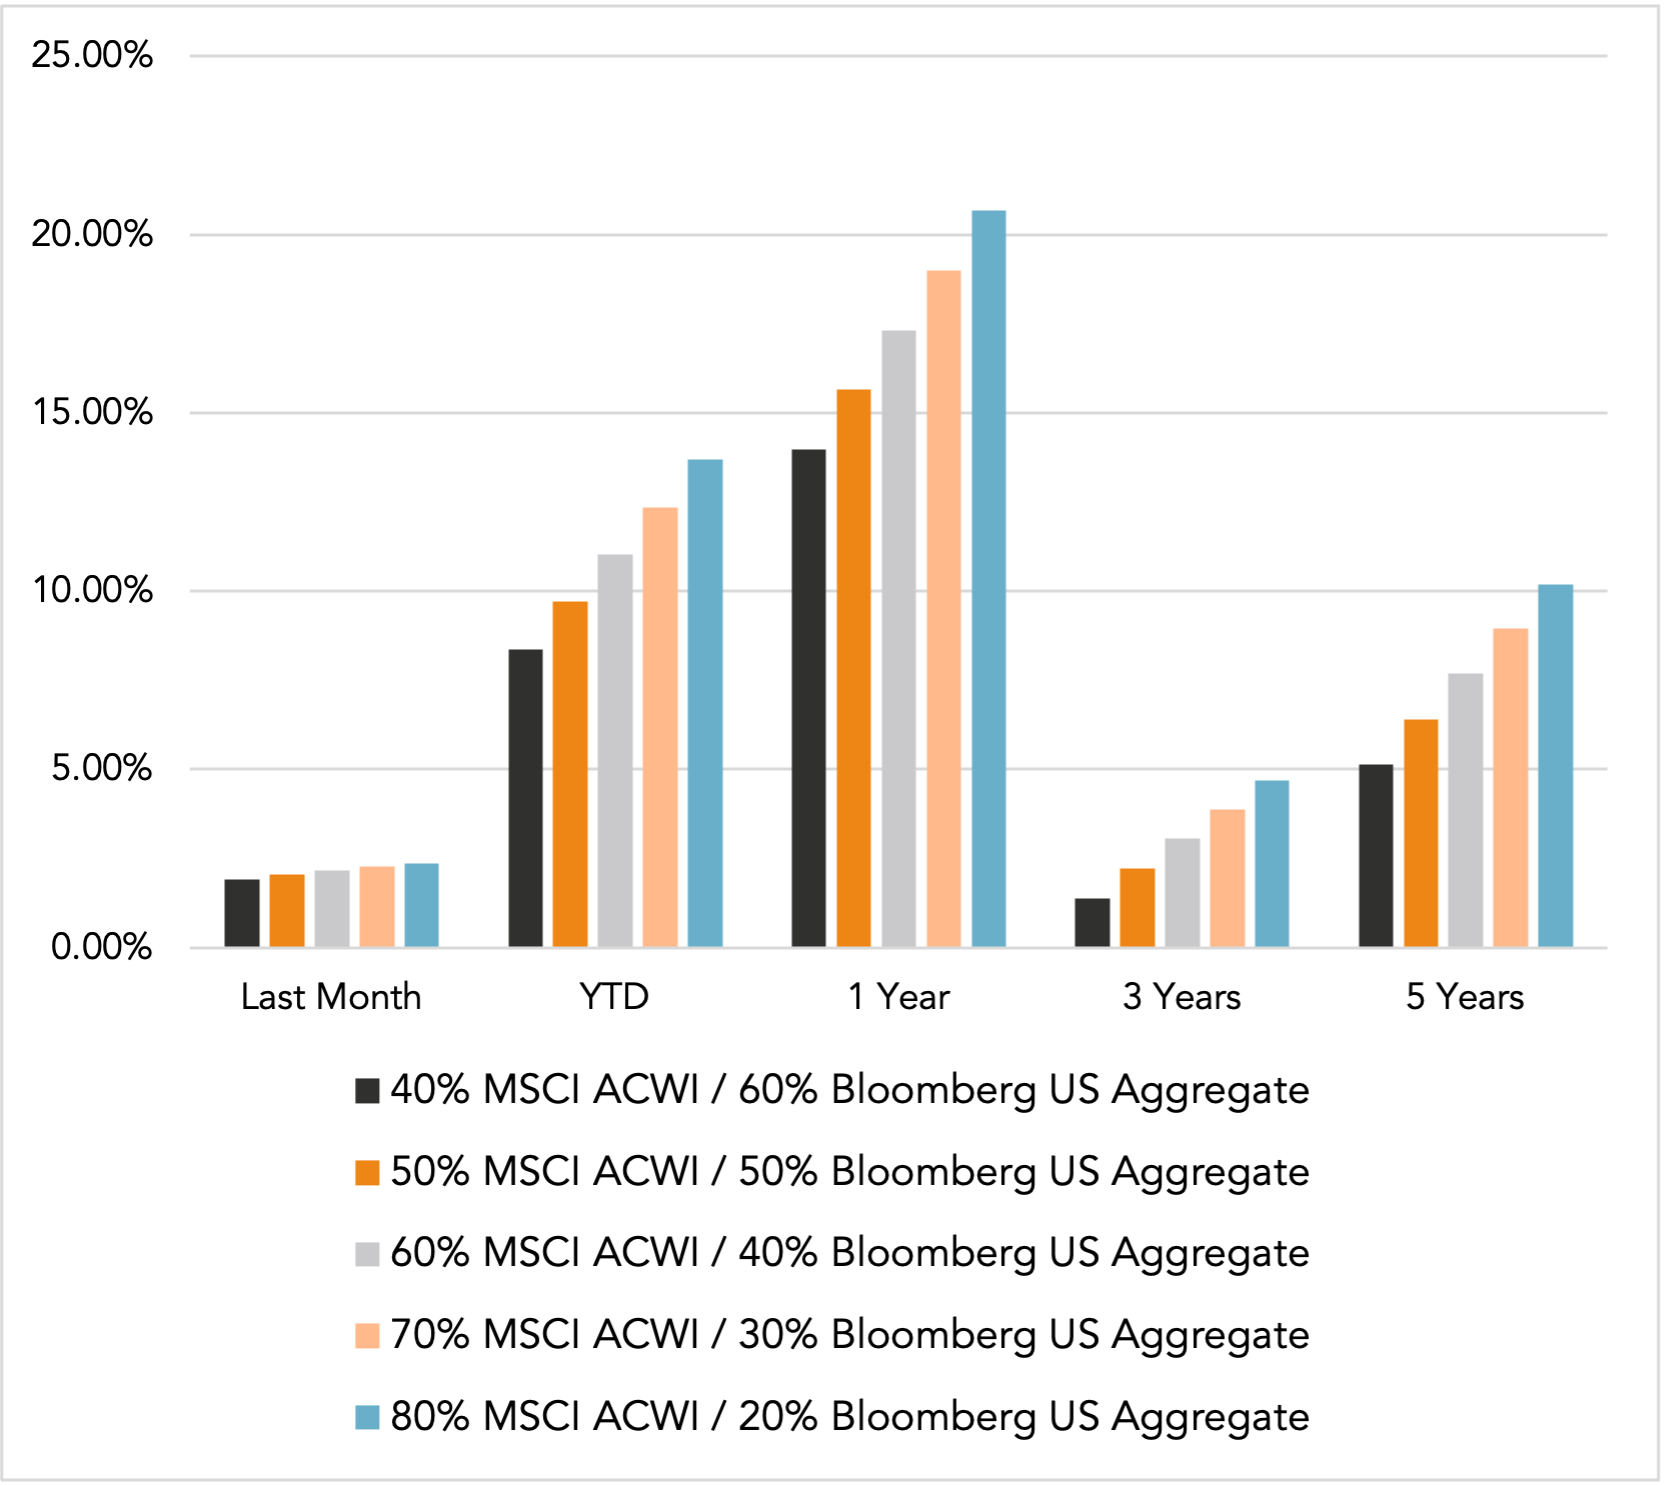
Mix Index Returns
Global Equity / US Taxable Bonds


Indexes are unmanaged and cannot be directly invested into. Past performance is no indication of future results. Investing involves risk and the potential to lose principal.
The Russell 3000 Index is a United States market index that tracks the 3000 largest companies. MSCI Emerging Markets Index is a broad market cap-weighted Index showing the performance of equities across 23 emerging market countries defined as emerging markets by MSCI. MSCI ACWI ex-U.S. Index is a free-float adjusted market capitalization-weighted index that is designed to measure the equity market performance of developed and emerging markets excluding companies based in the United States. Bloomberg U.S. Aggregate Bond Index represents the investment-grade, U.S. dollar-denominated, fixed-rate taxable bond market, including Treasuries, government-related and corporate securities, as well as mortgage and asset-backed securities. Bloomberg Municipal Index is the US Municipal Index that covers the US dollar-denominated long-term tax-exempt bond market. The index has four main sectors: state and local general obligation bonds, revenue bonds, insured bonds, and prerefunded bonds.


Market Update: September 2025 In Review